


1.
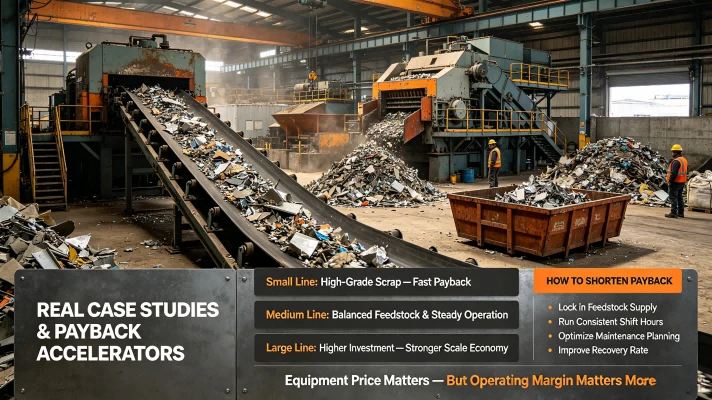
Based on our post-commissioning tracking of 200+ operational projects, the answer varies wildly - from as little as 6 months for well-configured lines processing high-grade scrap, to over 3 years for undersized, poorly matched lines processing low-margin material. The biggest mistake new operators make is calculating payback using only the equipment sticker price and theoretical maximum throughput. In reality, total startup investment runs 30–40% higher than the equipment quote alone, and actual throughput typically sits at 70–80% of rated capacity in the first year.
1. Core Misconceptions That Skew Payback Estimates
Nearly 60% of initial payback calculations we review are off by 30% or more, almost always on the optimistic side. Three errors account for most of the gap:
1.Only counting equipment cost
Many budgets stop at the machine price. They ignore installation, site preparation, auxiliary equipment and working capital, which typically add 35–45% to total startup investment.
2.Using rated peak capacity as actual output
No line runs at 100% rated capacity 250 days a year. Feedstock fluctuations, material changeover, maintenance and minor downtime all reduce real throughput. 70–80% utilization is a realistic baseline for the first year.
3.Ignoring recovery loss
Calculations often assume 100% of metal is recovered and sold at full market price. In reality, even well-run lines lose 2–8% of non-ferrous metal in tailings, depending on sorting configuration. Lower recovery directly eats into per-ton profit.
3. Standard Payback Calculation Framework
We use static payback period as the baseline industry indicator. It does not account for interest, inflation or long-term metal price volatility, but delivers a reliable reference for initial investment decision-making.
Core Formula
Static Payback Period (years) = Total Initial Investment ÷ Annual Net Profit
Total Initial Investment Breakdown
This is the single most undercounted figure for new investors. The table below shows typical cost structure for recycling line projects:
| Cost Category | Share of Total Investment | Notes |
|---|---|---|
| Core equipment package | 55 – 65% | Shredder, separators, conveyors, control system |
| Installation & commissioning | 8 – 12% of equipment cost | On-site assembly, calibration, test run |
| Site preparation & infrastructure | 10 – 15% | Equipment foundation, power supply, dust collection, lighting |
| Auxiliary equipment | 5 – 10% | Weighing scale, forklift, initial spare parts kit |
| Initial working capital | 10 – 15% | Raw material inventory, operating cash reserve |
Annual Net Profit Breakdown
Annual Net Profit = Annual Total Revenue - Annual Total Operating Cost
Annual Total Revenue = Total annual processed tonnage × weighted average selling price of sorted products
Annual Total Operating Cost includes: raw material purchase, labor, electricity, consumable parts, routine maintenance, site rent, transportation and administration fees
4. Real-World Case Studies by Line Scale
All figures below are compiled from actual operating data of RJ Mechanical commissioning projects across Southeast Asia and Africa, based on 250 working days per year and 75% average capacity utilization.
Case 1: Small Entry-Level Line (10–20 tpd)
Typical configuration: 600-type double shaft shredder + suspended magnetic separator + belt conveyors + manual sorting stationTarget material: Mixed waste household appliances, small motors, waste radiatorsRated capacity: 15 tpdActual operating output: 11–12 tpd
| Investment Item | Cost Range (USD) |
|---|---|
| Core equipment package | 22,000 – 32,000 |
| Installation & commissioning | 2,500 – 4,000 |
| Site preparation & basic infrastructure | 5,000 – 8,000 |
| Auxiliary tools & initial spare parts | 2,000 – 3,500 |
| Initial working capital | 6,000 – 10,000 |
| Total Initial Investment | 37,500 – 57,500 |
Operating & profit data:
Annual processed tonnage: 2,800 – 3,000 tons
Average revenue per ton of feedstock: $545
Average raw material cost: $450 / ton
Average operating cost: $72 / ton
Average net profit per ton: $23
Annual net profit: $64,400 – $69,000
Static payback period: 7 – 11 months
Case 2: Medium Standard Line (30–50 tpd)
Typical configuration: 800-type double shaft shredder + drum magnetic separator + eddy current separator + vibrating sizing screen + full conveyor systemTarget material: Mixed waste appliances, waste motors, ELV light scrap, radiator scrapRated capacity: 40 tpdActual operating output: 28–32 tpd
| Investment Item | Cost Range (USD) |
|---|---|
| Core equipment package | 78,000 – 110,000 |
| Installation & commissioning | 9,000 – 13,000 |
| Site preparation & power infrastructure | 18,000 – 28,000 |
| Auxiliary equipment & dust collection | 12,000 – 18,000 |
| Initial working capital | 22,000 – 35,000 |
| Total Initial Investment | 139,000 – 204,000 |
Operating & profit data:
Annual processed tonnage: 7,000 – 8,000 tons
Average revenue per ton of feedstock: $552 (higher non-ferrous recovery from ECS)
Average raw material cost: $450 / ton
Average operating cost: $64 / ton (economies of scale)
Average net profit per ton: $38
Annual net profit: $266,000 – $304,000
Static payback period: 6 – 8.5 months
Case 3: Large Industrial Line (80–120 tpd)
Typical configuration: 1000-type heavy-duty double shaft shredder + two-stage magnetic separation + eddy current separator + air classifier + baler + full automated conveying systemTarget material: Mixed ELV scrap, industrial steel scrap, bulk appliance wasteRated capacity: 100 tpdActual operating output: 70–80 tpd
| Investment Item | Cost Range (USD) |
|---|---|
| Core equipment package | 210,000 – 280,000 |
| Installation & commissioning | 28,000 – 38,000 |
| Site preparation & civil works | 45,000 – 70,000 |
| Auxiliary & environmental systems | 25,000 – 40,000 |
| Initial working capital | 60,000 – 90,000 |
| Total Initial Investment | 368,000 – 518,000 |
Operating & profit data:
Annual processed tonnage: 17,500 – 20,000 tons
Average revenue per ton of feedstock: $409 (lower non-ferrous share in industrial scrap)
Average raw material cost: $340 / ton
Average operating cost: $57 / ton (maximum scale effect)
Average net profit per ton: $24
Annual net profit: $380,000 – $440,000
Static payback period: 10 – 14 months
Summary Comparison Table
| Line Scale | Primary Feed Material | Rated Daily Capacity | Total Initial Investment | Annual Net Profit | Static Payback Period |
|---|---|---|---|---|---|
| Small Entry-Level | Mixed household appliances, small motors | 15 tpd | $37,500 – $57,500 | $64,400 – $69,000 | 7 – 11 months |
| Medium Standard | Mixed appliances, radiators, ELV light scrap | 40 tpd | $139,000 – $204,000 | $266,000 – $304,000 | 6 – 8.5 months |
| Large Industrial | Mixed ELV scrap, industrial steel scrap | 100 tpd | $368,000 – $518,000 | $380,000 – $440,000 | 10 – 14 months |
5. Sensitivity Analysis: What Shifts Your Payback Timeline?
Payback is never a fixed number. It moves with market conditions, operating performance and feedstock consistency. Based on our project database, the table below shows how each 10% change in key variables impacts payback period for a typical medium-sized line.
| Variable Factor | 10% Change | Impact on Payback Period |
|---|---|---|
| Capacity utilization / feed supply | +10% | -8% ~ -10% (faster payback) |
| -10% | +10% ~ +12% (slower payback) | |
| Market metal selling price | +10% | -15% ~ -18% (faster payback) |
| -10% | +18% ~ +22% (slower payback) | |
| Non-ferrous metal recovery rate | +10% | -12% ~ -15% (faster payback) |
| -10% | +15% ~ +18% (slower payback) | |
| Raw material purchase price | +10% | +20% ~ +25% (slower payback) |
| -10% | -20% ~ -22% (faster payback) | |
| Operating cost (labor + power + consumables) | +10% | +7% ~ +9% (slower payback) |
| -10% | -7% ~ -9% (faster payback) |
Raw material cost and metal selling price have the largest single impact, which is why stable supply contracts and consistent customer relationships matter more than almost any other factor. Recovery rate is the largest controllable internal factor - and the one most directly improved by better equipment and process tuning.
6. Proven Strategies to Shorten Payback Period
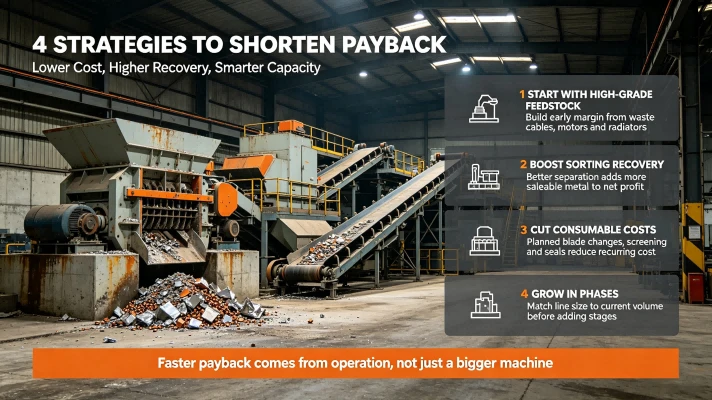
Based on our experience with top-performing client plants, these four measures consistently deliver faster payback without increasing initial investment.
6.1 Start with High-Grade Feedstock
Prioritize high-value scrap (waste cables, electric motors, AC radiators) in the first 6–12 months of operation to maximize per-ton profit. Once the core investment is paid down, expand into lower-margin high-volume scrap. Our data shows plants that start with high-grade feed cut payback time by 20–25% on average.
6.2 Optimize Sorting Recovery
As shown in the sensitivity table, a 10% improvement in non-ferrous recovery cuts payback by 12–15%. Implement the optimization measures we covered in earlier guides: proper upstream magnetic separation, sizing screening before eddy current separators, and calibrated air separation on copper granulators. Every extra percent of recovered metal drops straight to net profit.
6.3 Reduce Consumable Cost
Blades, screens and seals are the largest recurring operating cost after raw material. Using matched blade grades, scheduled maintenance and timely resharpening reduces annual consumable cost by 30–40%, as we detailed in our shredder blade life extension guide. Lower operating cost directly translates to faster payback.
6.4 Use Phased Expansion Instead of Oversizing
Many investors buy a larger line than their current feed volume supports to "future-proof". This leads to low capacity utilization and extended payback. Instead, start with a line matched to your current feed volume, then add secondary shredding or sorting stages as volume grows. This reduces initial investment by 30–40% and cuts early-stage payback time dramatically.
7. RJ Mechanical: Maximize Your ROI From Day One
At RJ Mechanical, we don't just sell shredding and sorting lines - we design solutions optimized for your feed material, capacity and budget to deliver the fastest possible payback.
What we deliver
Pre-project feedstock testingSend us your scrap samples, and we run full sorting tests on our in-house equipment. We provide a detailed profit projection and payback estimate based on real test data, not theoretical catalog specs.
Right-sized modular configurationsWe never oversell. Our engineers design your line to match your actual current feed volume, with clear upgrade paths for future growth. You pay for what you need now, not what you might need later.
Industry-leading recovery performanceOur eddy current separators, copper granulators and magnetic separation systems deliver top-tier recovery rates, ensuring you capture more sellable metal from every ton of feedstock. Higher recovery = faster payback.
Transparent itemized quotationsWe provide full breakdowns covering equipment, installation, commissioning and operator training. No hidden fees, no surprise add-ons. You know your total investment upfront for accurate financial planning.
Post-commissioning performance supportWe stay on site until your line hits rated performance, and provide ongoing optimization advice to keep recovery and efficiency high as your feedstock changes.
Final Note
The payback period of a scrap metal shredding and sorting line is not a number quoted by a supplier. It is determined by how well the equipment matches your material, how efficiently you operate it, and how stable your feed supply and product pricing are.
For well-configured lines processing consistent feedstock, payback within 12 months is achievable across all scales. For under-designed lines with poor sorting efficiency, payback can stretch to 2–3 years or even longer. The biggest mistake new investors make is choosing the cheapest equipment upfront, then giving up years of extra profit to lower recovery and higher downtime.
If you are planning a new shredding and sorting line and want a realistic payback estimate for your specific material and scale, contact RJ Mechanical for a free feedstock evaluation and project proposal.